
SRE in Practice | Day 6: SLIs: What Users Experience
Define and measure Service Level Indicators from the user's side. Six hands-on labs: log-based SLIs, valid events, combined SLIs, and a synthetic probe.

✍️ Translate this blog into Hindi, Tamil or Telugu
What you will learn
- What an SLI is and how to choose good ones
- How to write an SLI specification and implementation
- How defining valid events changes results
- Six hands-on labs, including a safe synthetic probe against a local server
Safety first: All commands are read-only or touch only files under /tmp/sre-lab that you create. Run them on a system you are authorized to use. Never run cleanup or deletion commands on real data until you have reviewed a dry run, and do not paste logs containing credentials or customer data into public posts.
1. What is a Service Level Indicator?
A Service Level Indicator (SLI) is a measurement of how well a service is behaving, from the user's point of view. The most useful SLIs are written as a ratio:
SLI = good events / valid events x 100%
An event is something users do, such as a request. A good event meets your quality bar. A valid event is one you have decided counts. A result between 0% and 100% is easy to compare, graph, and set targets on.
For example, if 9,940 of 10,000 requests succeeded, the availability SLI is 9,940 / 10,000 = 99.4%.
2. Choosing SLIs: start from what users care about
Do not start from the metrics you happen to have. Start from the things users do (critical user journeys, such as log in, search, or pay) and ask what a good experience means. Then pick a small number of SLIs, usually one to three per journey.
🛍️✨ From the author · ByteStoreCareer gap analysis and Mentoring - Basic Plan₹299View offer →
SLI specification vs implementation
The specification says what you want to measure: "the proportion of valid requests that succeed within 300 ms". The implementation says how: which logs, which load balancer metric, which probe. One specification can have several implementations, and they can disagree. Write both down.
Where to measure
3. A production-style example
This is an illustrative scenario. A checkout API is defined by two SLIs for its main journey:

Deciding what is valid matters. Counting a user's mistyped URL (a 404) as a failure would punish the service for something it did not get wrong. Decide, write it down, and keep it consistent.
4. Hands-on labs
Safety notes: All commands are read-only or touch only files under /tmp/sre-lab that you create. Run them on a system you are authorized to use. Never run cleanup or deletion commands on real data until you have reviewed a dry run, and do not paste logs containing credentials or customer data into public posts.
Setup: create a sample access log
The sample log has 6,000 requests over three minutes. Field 9 is the HTTP status and field 11 is the request time in seconds. Minute 10:01 contains a deliberate error spike so the later calculations have something to find.
mkdir -p /tmp/sre-lab && cd /tmp/sre-lab

awk 'BEGIN{
  for(i=1;i<=6000;i++){
    m=int((i-1)/2000); s=200
    if(i%200==0) s=500
    else if(m==1 && i%20==0) s=500
    else if(i%97==0) s=404
    t=0.05+(i%20)*0.01
    if(i%50==0) t=1.5
    ts=sprintf("[01/Nov/2026:10:%02d:00 +0000]", m)
    printf "10.0.0.%d - - %s \"GET /api HTTP/1.1\" %d 512 %.3f\n",
           (i%250)+1, ts, s, t
  }}' > access.log
Lab 1: availability and latency SLIs, minute by minute
A request is a good availability event if its status is below 500. It is a good latency event if it took 0.3 seconds or less.
awk '{split($4,a,":"); m=a[3]; t[m]++
      if ($9>=500) e[m]++; if ($11>0.3) s[m]++}
END{for(m in t) printf "10:%s  requests=%d  availability=%.2f%%  fast=%.2f%%\n",
    m, t[m], (t[m]-e[m])/t[m]*100, (t[m]-s[m])/t[m]*100}' access.log | sort
Expected output
10:00  requests=2000  availability=99.50%  fast=98.00%
10:01  requests=2000  availability=95.00%  fast=98.00%
10:02  requests=2000  availability=99.50%  fast=98.00%
The availability SLI dropped to 95.00% at 10:01 while the latency SLI stayed at 98.00%. Two SLIs can tell different stories about the same incident.
Lab 2: overall SLIs, and the effect of defining valid events
awk '{t++; if ($9>=500) e++; if ($9<400 || $9>=500) v++}
     END{printf "all requests: %.2f%%   valid only (4xx excluded): %.2f%%\n",
         (t-e)/t*100, (v-e)/v*100}' access.log
awk '{t++; if ($11<=0.3) f++}
     END{printf "latency SLI (<=300ms): %d/%d = %.2f%%\n", f, t, f/t*100}' access.log
Expected output
all requests: 98.00%   valid only (4xx excluded): 97.98%
latency SLI (<=300ms): 5880/6000 = 98.00%
Excluding the 404s from the denominator moves the result slightly (98.00% to 97.98%). The change is tiny here, but with many client errors it can be large, which is why the definition must be agreed and written down.
Lab 3: one combined "good request" SLI
Sometimes you want a single number: a request is good only if it succeeded and was fast.
awk '{t++; if ($9<500 && $11<=0.3) good++}
     END{printf "good=%d total=%d combined SLI=%.2f%%\n",
         good, t, good/t*100}' access.log
Expected output
good=5800 total=6000 combined SLI=96.67%The combined SLI (96.67%) is lower than either SLI alone, because a request can fail either test. Combining is simple to explain, but separate SLIs are easier to diagnose.
Lab 4: a synthetic probe against a local test server
🛍️✨ From the author · ByteStoreLinux & Cloud Administration Consultation | AWS & Azure Infrastructure Support₹499View offer →Real users are not always sending traffic, so teams also probe from the outside. Use two terminals. In terminal 1, start a throwaway web server that serves one file:
mkdir -p /tmp/sre-lab/www && echo ok > /tmp/sre-lab/www/health
cd /tmp/sre-lab/www
python3 -m http.server 8080 --bind 127.0.0.1      # leave this running
In terminal 2, define a probe that sends 20 requests and reports the SLI, then run it against a good path and a missing path:
cd /tmp/sre-lab
probe() {
  for i in $(seq 1 20); do
    curl -s -o /dev/null --max-time 2 -w "%{http_code} %{time_total}\n" \
         "http://127.0.0.1:8080/$1"
  done | awk '{t++; if ($1 ~ /^2/) ok++; s+=$2}
    END{printf "probes=%d good=%d success_rate=%.1f%% avg_latency=%.3fs\n",
        t, ok+0, (ok+0)/t*100, s/t}'
}
probe health
probe missing
Expected output
probes=20 good=20 success_rate=100.0% avg_latency=0.001s
probes=20 good=0 success_rate=0.0% avg_latency=0.001s
Latency will differ on your machine. Now go to terminal 1 and stop the server with Ctrl+C, then probe again:
probe health
curl -s -o /dev/null --max-time 2 http://127.0.0.1:8080/health
echo "curl exit code: $?"
Expected output
probes=20 good=0 success_rate=0.0% avg_latency=0.000s
curl exit code: 7
With the server stopped, every probe fails and curl exits with code 7 (could not connect). A probe sees the failure even when no real user is online, which is why synthetic SLIs complement log-based ones. A probe covers only the paths you test, so it is a sample, not the whole truth.
Lab 5 (optional, cloud): availability SLI in Azure
If your application sends telemetry to a workspace-based Application Insights resource, this Log Analytics query gives an availability-style SLI for the last hour. How "success" is defined (for example for 404s) depends on your configuration, so check it against your SLI specification. Table and column names differ for classic resources.
AppRequests
| where TimeGenerated > ago(1h)
| summarize good = countif(Success == true), total = count()
| extend sli_pct = 100.0 * good / total
Lab 6 (worksheet): write an SLI for your own service

5. Common mistakes
- Choosing SLIs from the metrics you already have, not from user journeys
- Tracking too many SLIs, so none gets attention
- Counting server health instead of user-visible results
- Leaving "valid events" undefined, so results are not comparable
- Using averages for latency SLIs instead of a threshold or percentile
- Trusting probes alone, or logs alone, without comparing them
6. Quick check: test yourself
- Write the SLI formula and calculate it for 9,940 good requests out of 10,000.
- Why is a ratio of good to valid events a useful form?
- In Lab 2, why did excluding 404s change the result?
- Name one strength and one weakness of synthetic probes.
- What is the difference between an SLI specification and its implementation?
Suggested answers: good / valid x 100 = 99.4%; it lies between 0 and 100% and is easy to compare and set targets on; the denominator got smaller; probes test even with no traffic but sample only the paths you test; the specification says what to measure and the implementation says how.
Glossary

The first ten days at a glance
Your turn: What would a good SLI be for the most important journey in a service you support?
Coming next, Day 7: SLOs and SLAs.
Follow @leadwithsree for the daily posts in this 30-day journey.
🛍️ Srilakshmi T's shelf
Courses, cohorts and more from the author
Cloud & Linux SRE Engineer with 5 years of IT experience, including Linux/Unix system administration and cloud platforms (AWS & Azure). Strong expertise in production support, reliability engineering, monitoring, automation, patching, and incident management across large-scale e
Visit my ByteStoreFreelancer - Cloud EngineerGet Srilakshmi T's next blog by email
One email a week when they publish. Add the weekly Best of ByteBlog too. No spam, unsubscribe with one click.
We email you once to confirm. By subscribing you agree to the privacy policy.
Related blogs
 Srilakshmi TFreelancer
SRE in Practice | Day 4 of 30 Toil and Automation
Reduce repetitive operational work. Measure toil, calculate automation payback, and build safe, idempotent scripts.
#sla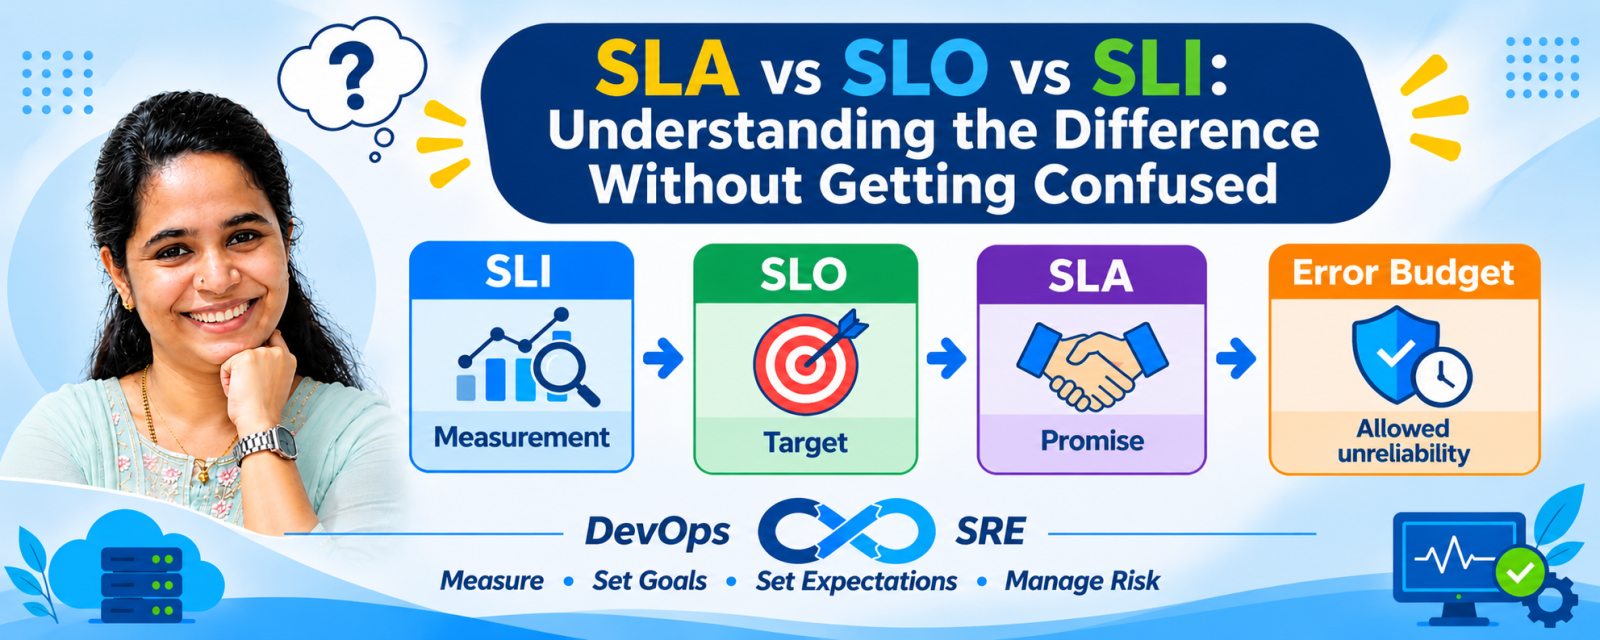
 Malathi ShettyFreelancer
SLA vs SLO vs SLI: Key Differences Explained
Understand SLA vs SLO vs SLI with simple examples. Learn how these concepts and Error Budgets help DevOps and SRE teams improve service reliability.
 Srilakshmi TFreelancer
SRE in Practice: DAY 1 OF 30 What is SRE?
Why a running server does not always mean a working service. Concept, production example,and a safe hands-on lab.
#aws Srilakshmi TFreelancer
SRE in Practice | Day 3: The SRE Mindset
Look beyond "Is the server up?" and ask whether the service works reliably for the people who depend on it. Concept, infrastructure example, and a hands-on lab.
💬 Comments (0)
Top · NewestSign in to comment