
Site Reliability Engineering for Beginners with One Real Service
What you build: one real Cloud Run service with an SLO, the SLI from Cloud Monitoring, a bad release, a rollback and a canary. Every step tested.

✍️ Translate this blog into Hindi, Tamil or Telugu
Site Reliability Engineering (SRE) sounds big: on-call rotations, error budgets, postmortems. At its heart it is a simple loop: decide what "working" means for users, measure it, notice quickly when it breaks, fix it fast, and change how you release so it breaks less. In this lab you run that whole loop on one real service on Cloud Run: write an SLO, measure the real SLI from Cloud Monitoring, ship a bad release, roll it back, then ship the same release safely as a canary.
Who it is for: developers, DevOps engineers and students who want to understand SRE by doing it once, end to end. Time: about 1.5 hours. Cost: a small Cloud Run service for about 25 minutes plus a few builds, covered by the free trial credit.
Every command below was run for real by the CareerByteCode Team, and every output is the real result we got. We typed the commands in a Cloud Shell-like Linux VM (Debian with gcloud, curl and python3); Cloud Shell in your browser has the same tools.
Part A: SRE in plain English
- SLI (service level indicator): a number that says how users experience the service. Ours: the share of requests that do not fail with a 5xx error.
- SLO (service level objective): the goal for the SLI. Ours: 99 percent over 30 days.
- Error budget: what the SLO allows to fail: 1 percent. Spend it on releases and experiments; when it is gone, slow down and fix reliability.
- Burn rate: how fast you are spending the budget. 1x means the budget lasts exactly the month; 20x means it is gone in about a day and a half.
- Rollback: go back to the last good version. Canary: give a new version a small share of traffic first.
- Postmortem: a blameless write-up of what happened, built from facts.
- Real-life example: an SLO is a train company promising 99 percent of trains on time. The error budget is the 1 percent late trains they can afford before passengers leave.

Before you start
A Google Cloud project with billing linked (the free trial works) and Cloud Shell open. Nothing else: the lab turns on the APIs it needs.
In Cloud Shell, set your project and make the lab folder. Save app.py, load.sh and sli.py (shown below) in ~/lab282; every box runs from there:
export PROJECT_ID=$(gcloud config get-value project)
mkdir -p ~/lab282 && cd ~/lab282
Part B: the lab
Step 1: the one real service
Why: we need something users depend on. A tiny "price" API answers GET /price/<item>. FAIL_RATE makes that share of requests fail with 500: version 1 runs with 0, the bad release with 0.2. Save it as app.py:
# app.py: the one real service, a tiny "price" API. FAIL_RATE (0 to 1) makes that share of requests fail with 500:
# version 1 runs with 0, the "bad release" with 0.2.
import os, random, time
from flask import Flask, jsonify

app = Flask(__name__)
FAIL_RATE = float(os.environ.get("FAIL_RATE", "0"))


@app.get("/price/<item>")
def price(item):
    time.sleep(random.uniform(0.01, 0.05))
    if random.random() < FAIL_RATE:
        return jsonify(error="internal error"), 500
    return jsonify(item=item, price=round(random.uniform(100, 999), 2), version=os.environ.get("K_REVISION", "local"))
We deploy it to Cloud Run with authentication required and at most 3 copies. A source deploy builds the container for us; the default build account needs the Cloud Run Builder role once:
# The one real service: deploy version 1 of the price API to Cloud Run (sign-in required, at most 3 copies)
gcloud services enable run.googleapis.com cloudbuild.googleapis.com artifactregistry.googleapis.com monitoring.googleapis.com > /dev/null && echo "APIs on"
PNUM=$(gcloud projects describe $PROJECT_ID --format="value(projectNumber)")
until gcloud projects add-iam-policy-binding $PROJECT_ID --member="serviceAccount:$PNUM-compute@developer.gserviceaccount.com" --role=roles/run.builder --condition=None --format="value(etag)" > /dev/null 2>&1; do sleep 5; done; echo "granted roles/run.builder to the build account"
mkdir -p svc && cp app.py svc/ && printf 'flask==3.1.*\ngunicorn==23.*\n' > svc/requirements.txt && printf 'web: gunicorn --bind :$PORT --workers 1 --threads 8 app:app\n' > svc/Procfile
cd ~/lab282/svc && gcloud run deploy price-api --source . --region=us-east1 --no-allow-unauthenticated --set-env-vars=FAIL_RATE=0 --max-instances=3 --quiet 2>&1 | tail -2
Operation "operations/acat.p2-PROJECT_NUMBER-f73b2215-5fa6-45a6-b1ea-d2b85b915ad6" finished successfully.
APIs on
granted roles/run.builder to the build account
Service URL: https://price-api-PROJECT_NUMBER.us-east1.run.app
Proxy locally with: gcloud run services proxy price-api --region us-east1 --project your-project-idStep 2: write the promise down
Why: an SLO is a decision, not a measurement. Write it down with what it allows:
# Write the promise down: SLI = share of requests that do not fail with 5xx. SLO = 99 percent over 30 days.
# Error budget = the 1 percent we may fail: in requests, and in minutes if everything failed at once
python3 -c "m = 30 * 24 * 60; print(f'99% of 30 days: {m * 0.01:.0f} minutes of full outage allowed a month ({m * 0.01 / 30:.1f} a day)'); print(f'at 1,000,000 requests a month: {1000000 * 0.01:.0f} failed requests allowed')"
99% of 30 days: 432 minutes of full outage allowed a month (14.4 a day)
at 1,000,000 requests a month: 10000 failed requests allowed99 percent sounds strict, but it allows 432 minutes of full outage a month, or 10,000 failed requests out of a million.
Step 3: normal traffic and the real SLI
Why: we measure the SLI from the platform, not from our own load tool. load.sh sends about 10 requests a second (with an identity token, because the service needs sign-in):
#!/bin/bash
# load.sh <url> <seconds>: about 10 requests a second, like real users; prints the answers by HTTP status at the end
URL=$1; end=$((SECONDS + $2)); : > load.log
TOKEN=$(gcloud auth print-identity-token)
while [ $SECONDS -lt $end ]; do
  for i in 1 2 3 4 5; do curl -s -o /dev/null -w "%{http_code}\n" -H "Authorization: Bearer $TOKEN" $URL/price/item$i >> load.log & done
  wait; sleep 0.4
done
echo "requests: $(wc -l < load.log), by status: $(sort load.log | uniq -c | awk '{printf "%s x%s  ", $2, $1}')"
sli.py reads Cloud Run's request count from Cloud Monitoring for the last N minutes, split by answer class (2xx, 4xx, 5xx), and works out the SLI and the burn rate:
# sli.py <minutes>: read Cloud Run's request count from Cloud Monitoring for the last N minutes, split by answer class
# (2xx, 4xx, 5xx), and print the SLI (share of good requests) and how much of a 99 percent error budget that spends.
import json, os, subprocess, sys, time, urllib.parse, urllib.request

minutes = int(sys.argv[1])
project = os.environ["PROJECT_ID"]
token = subprocess.run(["gcloud", "auth", "print-access-token"], capture_output=True, text=True).stdout.strip()
end = time.time(); start = end - minutes * 60
fmt = lambda t: time.strftime("%Y-%m-%dT%H:%M:%SZ", time.gmtime(t))
q = {"filter": 'metric.type="run.googleapis.com/request_count" AND resource.labels.service_name="price-api"',
     "interval.startTime": fmt(start), "interval.endTime": fmt(end),
     "aggregation.alignmentPeriod": f"{minutes * 60}s", "aggregation.perSeriesAligner": "ALIGN_SUM",
     "aggregation.crossSeriesReducer": "REDUCE_SUM", "aggregation.groupByFields": "metric.labels.response_code_class"}
url = f"https://monitoring.googleapis.com/v3/projects/{project}/timeSeries?" + urllib.parse.urlencode(q)
data = json.load(urllib.request.urlopen(urllib.request.Request(url, headers={"Authorization": "Bearer " + token})))
counts = {}
for s in data.get("timeSeries", []):
    counts[s["metric"]["labels"]["response_code_class"]] = sum(int(p["value"]["int64Value"]) for p in s["points"])
total = sum(counts.values()); bad = counts.get("5xx", 0)
if not total:
    print(f"last {minutes} min: no requests counted yet (metrics arrive after 2 to 4 minutes)"); sys.exit(0)
sli = 100 * (total - bad) / total
print(f"last {minutes} min: {total} requests {dict(sorted(counts.items()))} | SLI {sli:.2f}% good | "
      f"burn rate {(100 - sli) / 1:.1f}x of a 99% SLO (1x = budget lasts the whole month)")
Metrics reach Cloud Monitoring 2 to 4 minutes late, so we wait 3 minutes after the load:
# Normal traffic for 2 minutes, then wait for Cloud Monitoring and read the real SLI
cd ~/lab282
chmod +x load.sh; URL=$(gcloud run services describe price-api --region=us-east1 --format="value(status.url)")
./load.sh $URL 120; sleep 180; python3 sli.py 6
requests: 795, by status: 200 x795
last 6 min: 795 requests {'2xx': 795} | SLI 100.00% good | burn rate 0.0x of a 99% SLO (1x = budget lasts the whole month)
Our load counted 795 answers, all 200; Cloud Monitoring counted the same 795. SLI 100 percent, burn rate 0.
Break it: a bad release goes to everyone
Version 2 fails 20 percent of requests (a bug that slipped through), and a normal deploy sends all traffic to it:
# Break it: a bad release (version 2 fails 20 percent of requests) goes to ALL users at once
cd ~/lab282/svc && gcloud run deploy price-api --source . --region=us-east1 --no-allow-unauthenticated --set-env-vars=FAIL_RATE=0.2 --max-instances=3 --quiet 2>&1 | tail -1; cd ..
URL=$(gcloud run services describe price-api --region=us-east1 --format="value(status.url)")
echo "bad release live at $(date -u +%H:%M:%S) UTC"; ./load.sh $URL 120; sleep 180; python3 sli.py 4
Proxy locally with: gcloud run services proxy price-api --region us-east1 --project your-project-id
bad release live at 07:53:47 UTC
requests: 790, by status: 200 x632 500 x158
last 4 min: 716 requests {'2xx': 572, '5xx': 144} | SLI 79.89% good | burn rate 20.1x of a 99% SLO (1x = budget lasts the whole month)158 of 790 requests failed. Cloud Monitoring agrees: SLI 79.89 percent, a burn rate of 20.1x. At that speed, a month's error budget is gone in about a day and a half. This is the moment an SRE alert (for example "burn rate above 14.4x for 5 minutes") would page someone.
Fix it: roll back
Why: the fastest fix for a bad release is to go back, then find the bug calmly. Cloud Run keeps every revision, so a rollback is one traffic change, with no rebuild:
# Fix it: roll back. Cloud Run keeps every revision, so we send 100 percent of traffic to the first one
R1=$(gcloud run revisions list --service=price-api --region=us-east1 --sort-by=metadata.creationTimestamp --format="value(metadata.name)" | head -1)
gcloud run services update-traffic price-api --region=us-east1 --to-revisions=$R1=100 2>&1 | tail -1; echo "rolled back at $(date -u +%H:%M:%S) UTC"
URL=$(gcloud run services describe price-api --region=us-east1 --format="value(status.url)")
./load.sh $URL 120; sleep 180; python3 sli.py 4
100% price-api-00001-5wp
rolled back at 07:59:08 UTC
requests: 765, by status: 200 x765
last 4 min: 437 requests {'2xx': 437, '5xx': 0} | SLI 100.00% good | burn rate 0.0x of a 99% SLO (1x = budget lasts the whole month)All 765 requests succeeded after the rollback, and the SLI is back to 100 percent.

Step 4: next time, a canary
Why: the same bad version again, but this time deployed with --no-traffic under the tag canary, then given only 10 percent of the traffic:
# Do it better next time: a canary. The new revision gets only 10 percent of traffic, under its own tag
cd ~/lab282/svc && gcloud run deploy price-api --source . --region=us-east1 --no-allow-unauthenticated --set-env-vars=FAIL_RATE=0.2 --max-instances=3 --no-traffic --tag=canary --quiet 2>&1 | tail -1; cd ..
R1=$(gcloud run revisions list --service=price-api --region=us-east1 --sort-by=metadata.creationTimestamp --format="value(metadata.name)" | head -1)
gcloud run services update-traffic price-api --region=us-east1 --to-tags=canary=10 2>&1 | tail -1
gcloud run services describe price-api --region=us-east1 --format="table(status.traffic[].revisionName,status.traffic[].percent,status.traffic[].tag)"
URL=$(gcloud run services describe price-api --region=us-east1 --format="value(status.url)")
./load.sh $URL 90Proxy locally with: gcloud run services proxy price-api --region us-east1 --project your-project-id
canary: https://canary---price-api-abcdefghij-ue.a.run.app
REVISION_NAME PERCENT TAG
['price-api-00001-5wp', 'price-api-00004-yuj'] [90, 10] [None, 'canary']
requests: 595, by status: 200 x582 500 x1313 failed requests out of 595 instead of 158 out of 790: the canary limited the damage to the 10 percent of users on the new version, and the 5xx rate on that revision tells you to stop. (Cloud Run also gives the tagged revision its own address, so you can test it before it gets any traffic.)
Step 5: the facts for the postmortem
Why: a postmortem is built from facts, not memory. Cloud Run records every revision with its creation time and settings:
# The postmortem facts, from the platform: which revision ran when, and what the users saw
gcloud run revisions list --service=price-api --region=us-east1 --sort-by=metadata.creationTimestamp --format="table(metadata.name,metadata.creationTimestamp.date('%H:%M:%S'),spec.containers[0].env[0].value:label=FAIL_RATE)"
NAME CREATION_TIMESTAMP FAIL_RATE
price-api-00001-5wp 07:47:02 0
price-api-00002-fbv 07:53:30 0.2
price-api-00004-yuj 08:04:52 0.2
Together with the times our steps printed, the timeline is complete:
| Time (UTC) | What happened |
|---|---|
| 07:47 | Version 1 (FAIL_RATE 0) live; SLI 100 percent |
| 07:53 | Version 2 (FAIL_RATE 0.2) goes to 100 percent of traffic |
| 07:53 to 07:59 | SLI 79.89 percent, burn rate 20.1x |
| 07:59 | Rolled back to version 1; SLI 100 percent |
| 08:04 | The same version 2 as a 10 percent canary: 13 failed of 595 |
A blameless postmortem then asks: why did our tests not catch a 20 percent failure rate, and why did the release go to everyone at once? The actions: add the test, and make canary the default.
POC: prove it works
- The SLO and its error budget were written down with real numbers (Step 2).
- The SLI came from Cloud Monitoring and matched our own count (Step 3).
- The bad release showed as SLI 79.89 percent and burn rate 20.1x; the rollback brought it to 100 percent (Break it, Fix it).
- The canary limited the same bug to 13 failed requests (Step 4).
Clean up (delete everything)
Why: the service, its image repository and the build role we granted should not stay behind.
# Clean up: the service (with all revisions), the build role and the image repository
gcloud run services delete price-api --region=us-east1 --quiet 2>&1 | tail -1
PNUM=$(gcloud projects describe $PROJECT_ID --format="value(projectNumber)")
gcloud projects remove-iam-policy-binding $PROJECT_ID --member="serviceAccount:$PNUM-compute@developer.gserviceaccount.com" --role=roles/run.builder --condition=None > /dev/null 2>&1 && echo "build role removed"
gcloud artifacts repositories delete cloud-run-source-deploy --location=us-east1 --quiet 2>&1 | tail -1
echo "left: $(gcloud run services list --format='value(name)' 2>/dev/null | wc -l) Cloud Run services, $(gcloud artifacts repositories list --format='value(name)' 2>/dev/null | wc -l) repositories"
Deleted service [price-api].
build role removed
Deleted repository [cloud-run-source-deploy].
left: 0 Cloud Run services, 0 repositoriesThe source deploys also uploaded your code to a Cloud Storage bucket (named run-sources-...). Delete it too (prints one line per bucket it deletes):
for b in $(gcloud storage buckets list --format="value(name)" | grep -E "run-sources|cloudbuild"); do gcloud storage rm -r gs://$b --quiet > /dev/null 2>&1 && echo "deleted bucket (source upload)"; doneFAQ
Is 99 percent the right SLO? It depends on what users need and what you can afford. Start a little below what you achieve today, then tighten it. Never promise 100 percent.
Should the SLI include 4xx errors? Usually not: 404 or 400 are mostly the caller's mistake. We count 5xx (our failures) as bad.
Where do burn-rate alerts live? In Cloud Monitoring you can create an SLO for a Cloud Run service and alert on its burn rate. We computed it ourselves here to show the math; we did not create the alert policy.
Rollback or fix forward? Roll back when the old version is safe (as here). Fix forward when you cannot go back, for example after a database change (see expand and contract).
What is the difference between SRE and DevOps? DevOps is the culture of building and running software together; SRE is one concrete way to do it, with SLOs, error budgets and engineering work to reduce toil.
Troubleshooting
| You see | Why | Fix |
|---|---|---|
sli.py says no requests counted yet | Cloud Monitoring data arrives 2 to 4 minutes late | Wait, then run it again |
403 from the service | No or wrong identity token | gcloud auth print-identity-token |
| The deploy fails while building | The build account lacks the Cloud Run Builder role | Grant roles/run.builder to the default compute service account |
| A rollback does nothing | Traffic follows "latest", or the revision name is wrong | gcloud run services update-traffic --to-revisions=<good revision>=100 |
| The canary gets no traffic | Deployed with --no-traffic and never shifted | gcloud run services update-traffic --to-tags=canary=10 |
What next
- Change a database without downtime: the expand and contract pattern in Database Migrations in CI/CD Without Downtime.
- Build the whole delivery pipeline: DevOps Project for Your Resume: Full CI/CD on Google Cloud.
- More hands-on posts: ByteBlog. Practice in ByteLabs and see the courses.
Prepared by the CareerByteCode Team from our tested lab, with AI help for the write-up.
⭐ Keep learning with CareerByteCode
Hand-picked to go deeper on this topicGet CareerByteCode Team's next blog by email
One email a week when they publish. Add the weekly Best of ByteBlog too. No spam, unsubscribe with one click.
We email you once to confirm. By subscribing you agree to the privacy policy.
Related blogs
 CareerByteCode Team
FinOps for Beginners: Read and Cut Your Cloud Bill
What you build: SQL reports on a month of billing data (cost by service, team label and day), plus a real hunt for an unused disk and IP, in your own Google Cloud account. Every step tested.
#chaos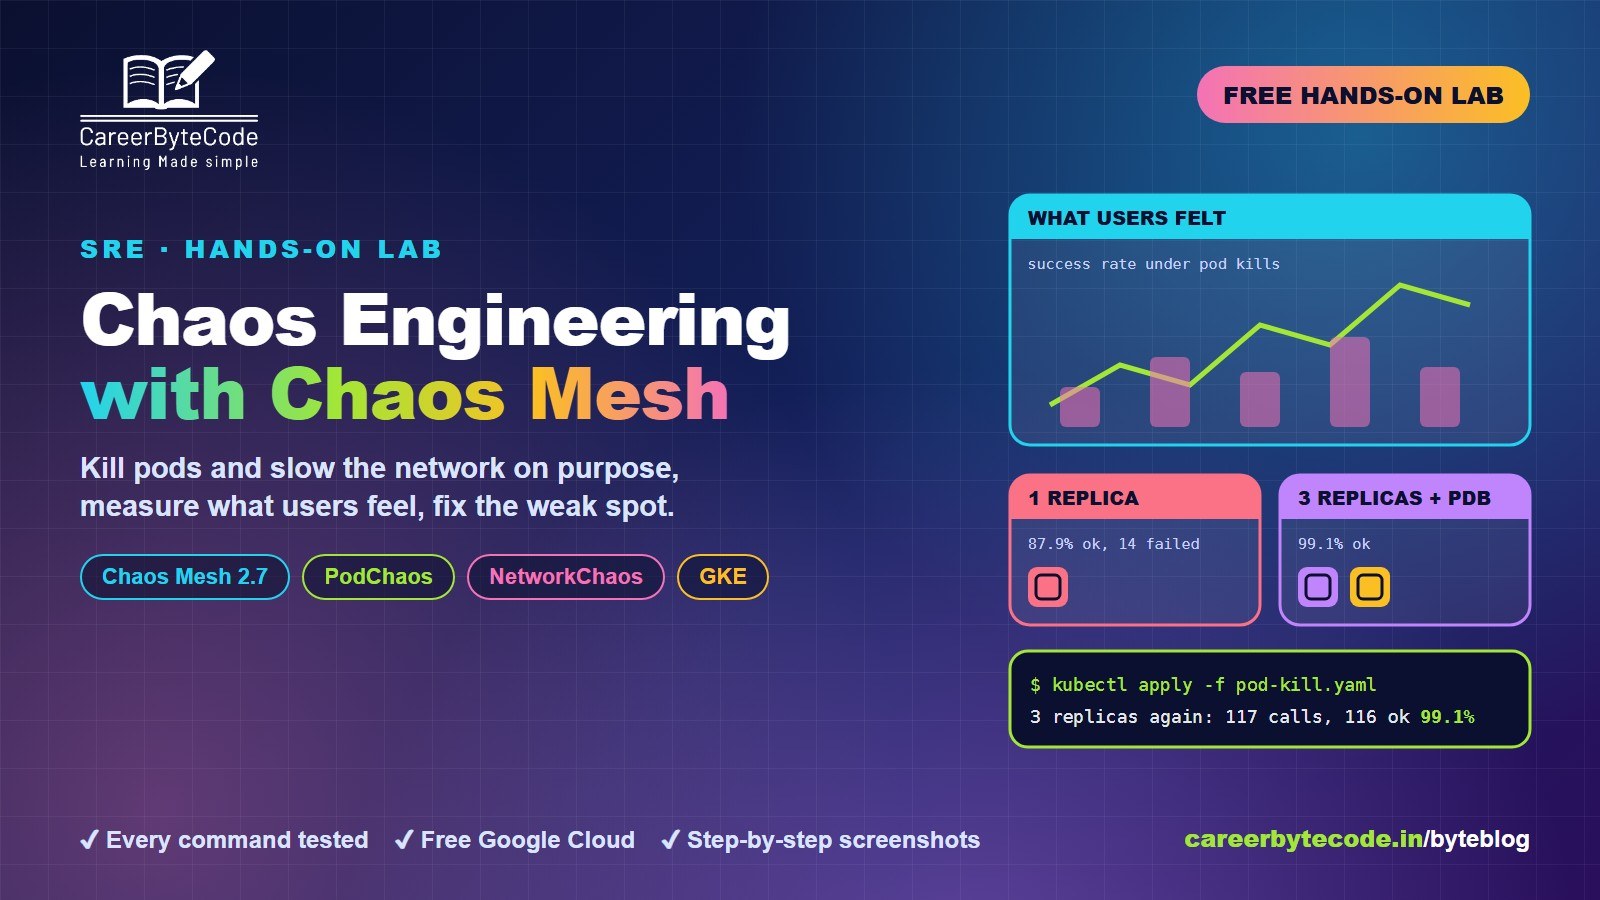 CareerByteCode Team
Chaos Engineering on Kubernetes with Chaos Mesh
What you build: Chaos Mesh on GKE killing pods and slowing the network, a weak setting found and fixed with real success rates. Every step tested.
#finops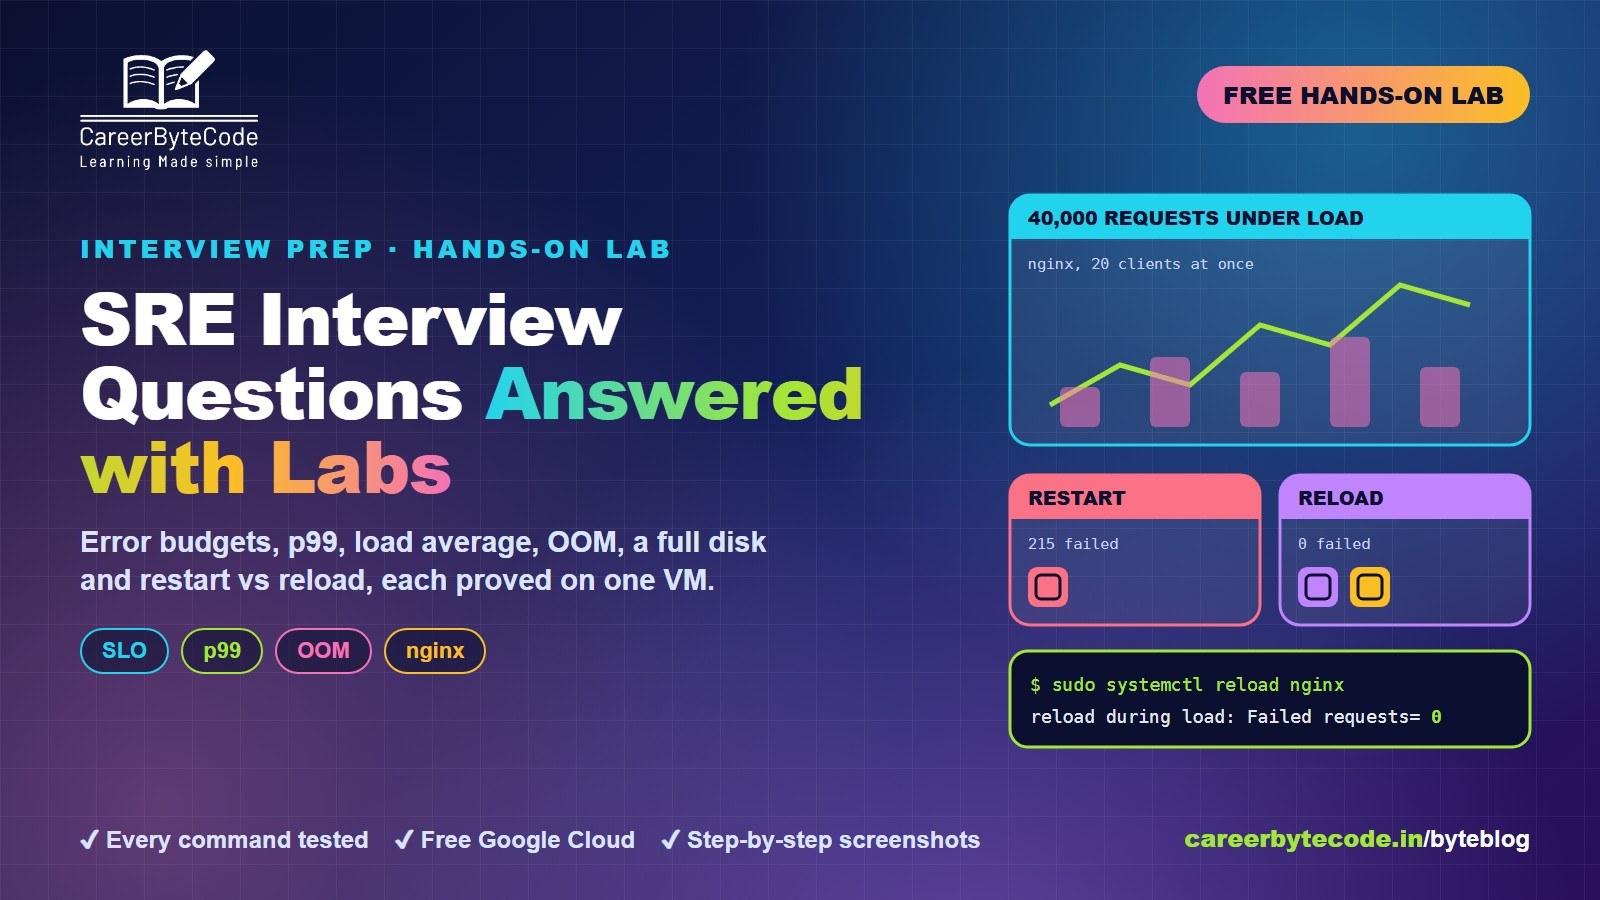 CareerByteCode Team
SRE Interview Questions Answered with Hands-On Labs
What you build: 8 SRE interview answers proved on one Linux VM: error budgets, burn rate, p99, load average, OOM, a full disk, restart vs reload. Every step tested.
#beginners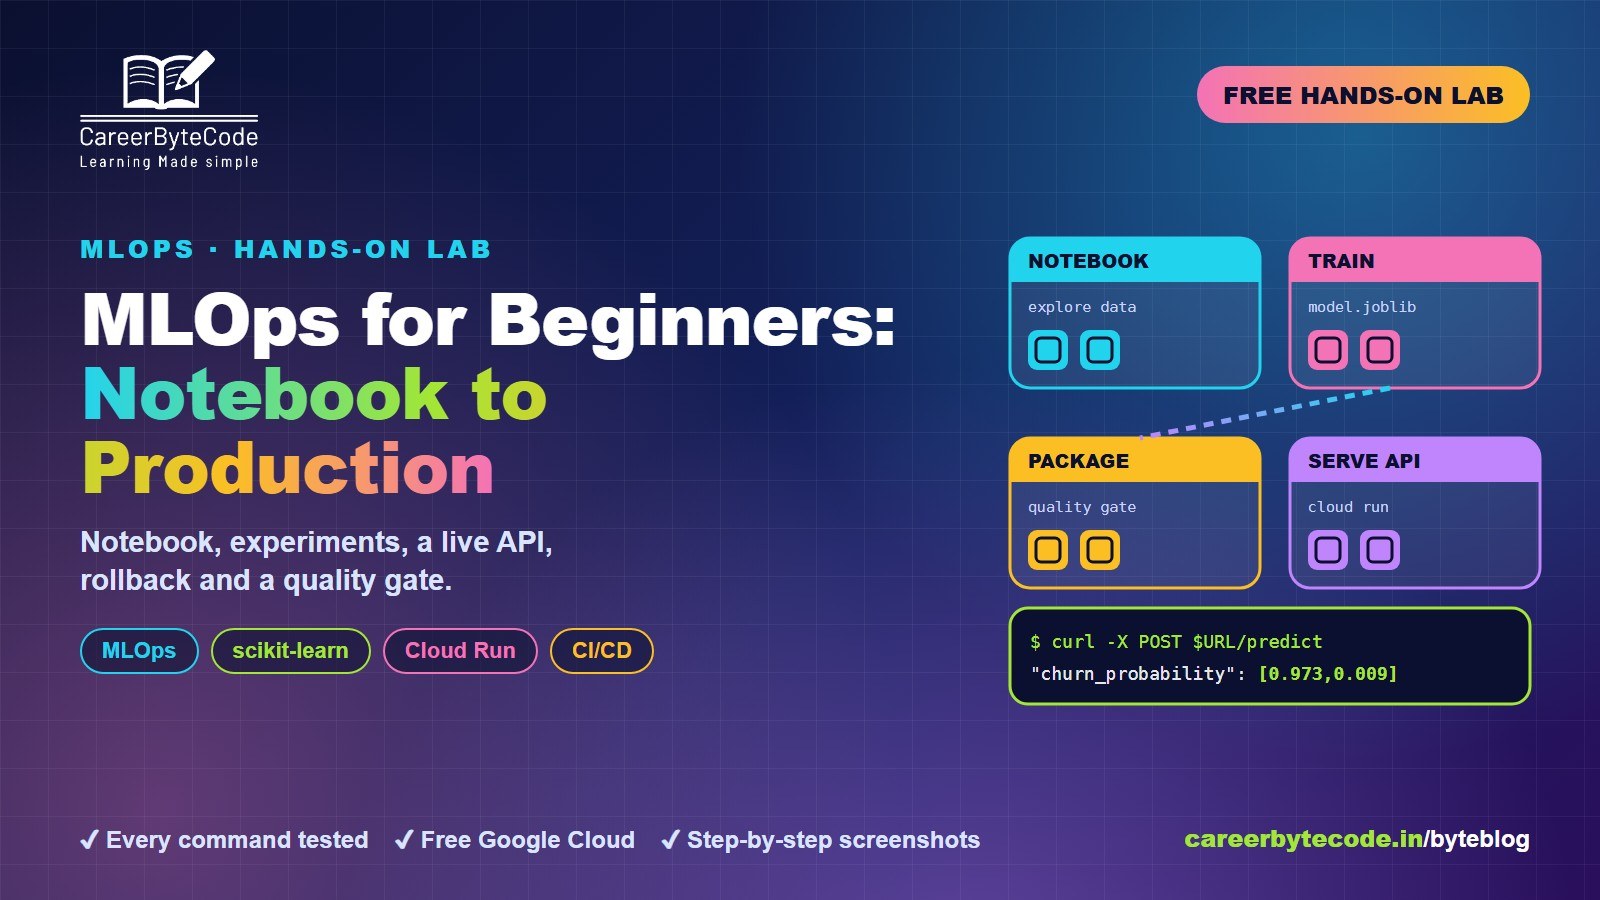 CareerByteCode Team
MLOps for Beginners: From Notebook to Production
What you build: a churn model trained in a Jupyter notebook, tracked runs, a live prediction API on Cloud Run with logs, a real bad release rolled back, and retraining behind a quality gate.
💬 Comments (0)
Top · NewestSign in to comment